Overview
An interactive product analytics dashboard for monitoring a SaaS platform. It surfaces the metrics that matter during an operational check: active users, revenue, error rate, p95 latency, traffic sources, and recent events.
Demo behavior
The local demo is intentionally self-contained. Visitors can switch between one-hour, daily, and weekly snapshots, and pause or resume the visual live update state. Each range updates the metric cards, revenue chart, traffic breakdown, and operational feed together.
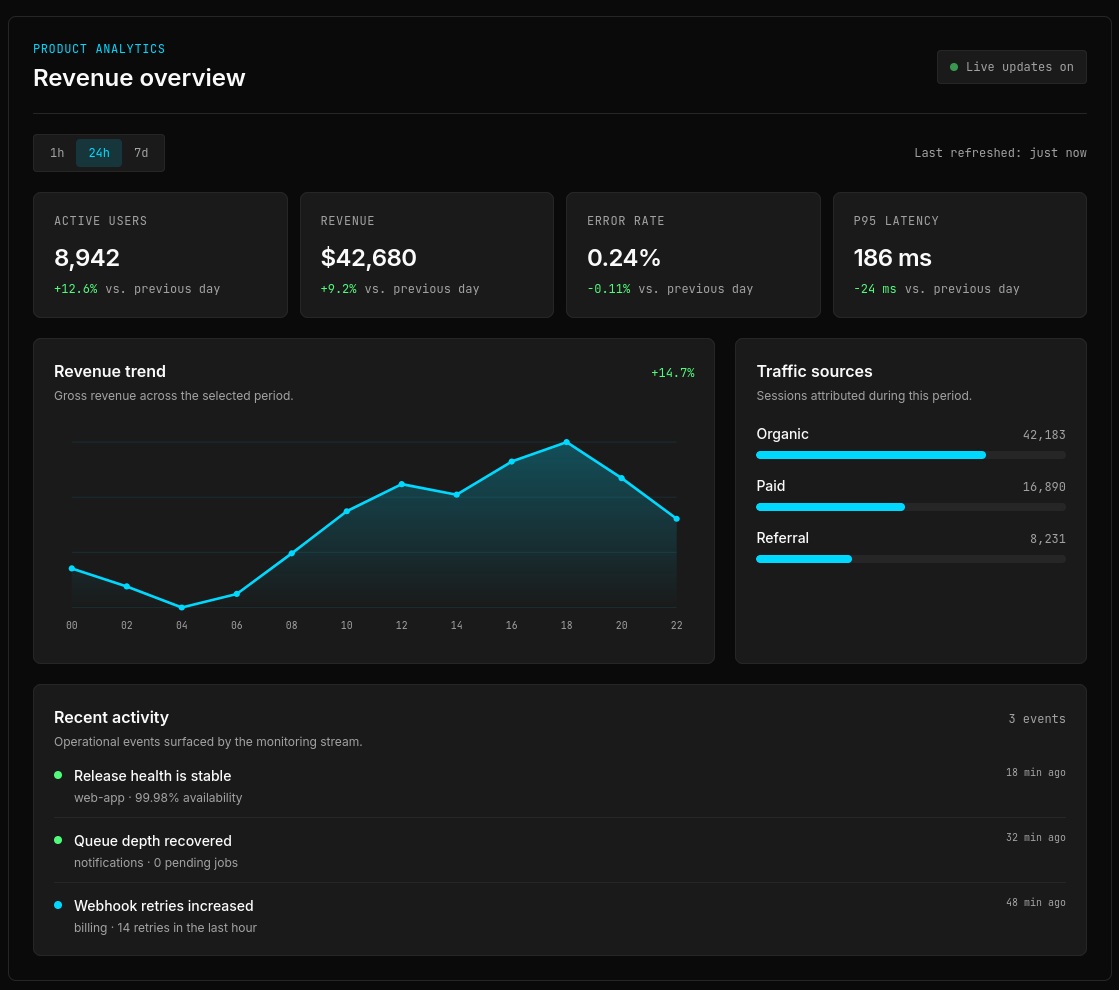
The dashboard keeps the operational read compact: headline metrics sit above the revenue trend, traffic-source breakdown, and recent activity feed. The selected time range updates the whole surface together, while the live-update indicator makes the current state visible at a glance.
Implementation notes
- The React island is registered explicitly for
/demos/dashboardand keeps its fixture data, components, and browser test alongside this document. - SVG renders the chart directly, avoiding a chart dependency for a small, portable demo.
- All UI colors use the portfolio tokens, so the dashboard automatically supports both Rony Classic and Modern visual variants.